Data Dashboards: A New Web Visualization Tool from Petro-Logistics and Oilytics
Read in 2 minutes
If you are interested in a free trial of any of the web dashboards discussed below, please contact our sales team here.
Petro-Logistics has partnered with data visualization platform Oilytics (oilytics.co) to offer a new set of tools to easily and quickly draw out analytical insights from our industry-standard tanker tracking and oil balances data.
The sheer volume of Petro-Logistics data can sometimes overwhelm, so these new web-based dashboard tools make it simple to manipulate and visualize the data in unique ways using key charts, tables, filters, and download options.
The following dashboards are available today.
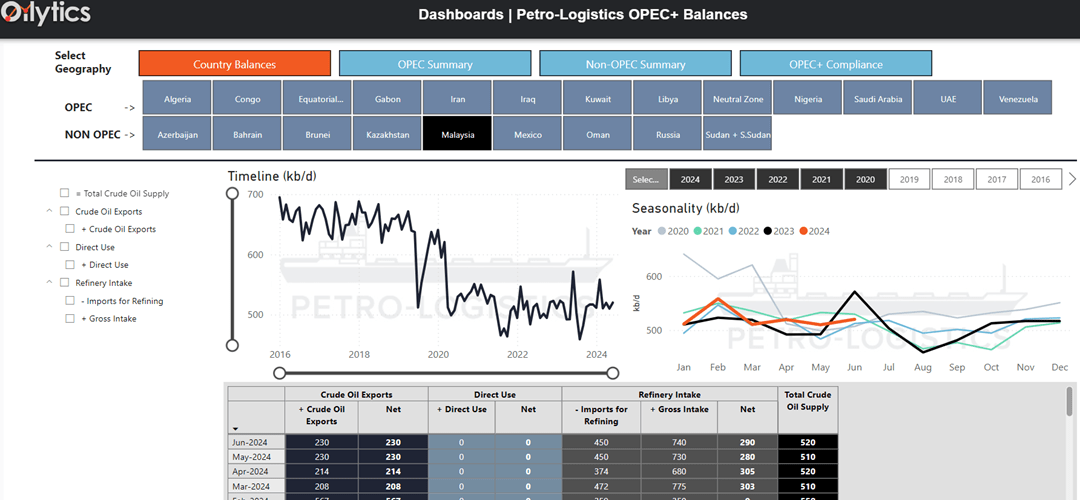
- OPEC+ Balances: Crude oil supply and demand balances for all the OPEC+ countries. This is essentially the dashboard version of our flagship weekly OPEC Production Monitor (OPM) report plus our Non-OPEC Supply report.
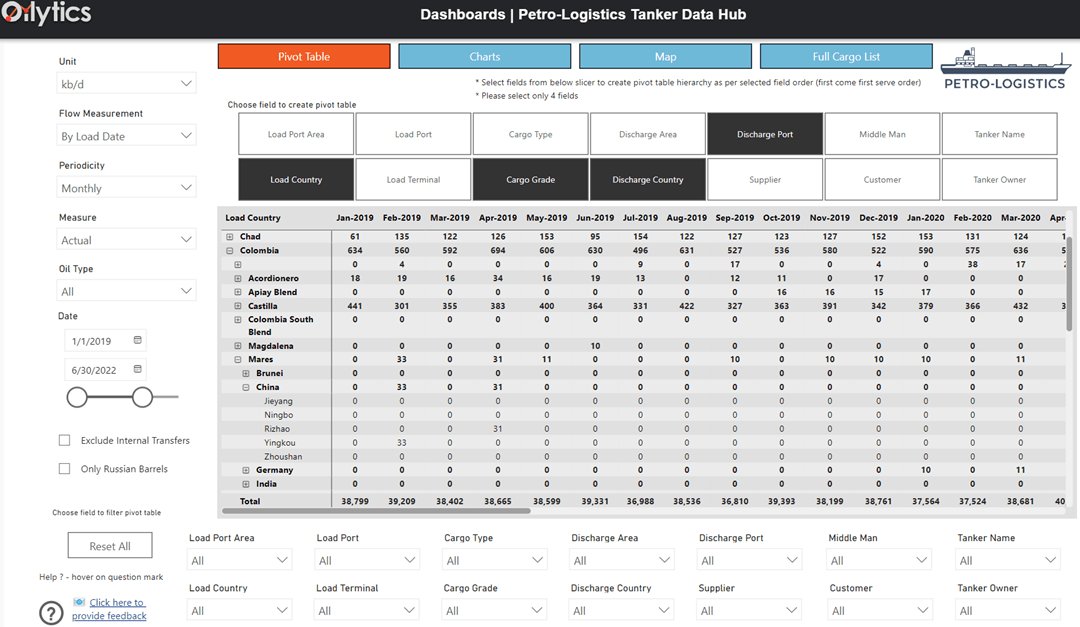
- Tanker Data Hub: The most comprehensive tool for macro- or micro-level viewing and manipulation of all our tanker-by-tanker data for crude oil, condensate, and upgraded crude. See global, regional or local trends, or zoom in to individual tankers, ports, and companies. Take fuller advantage of Petro-Logistics unique grade-level information than ever possible before.
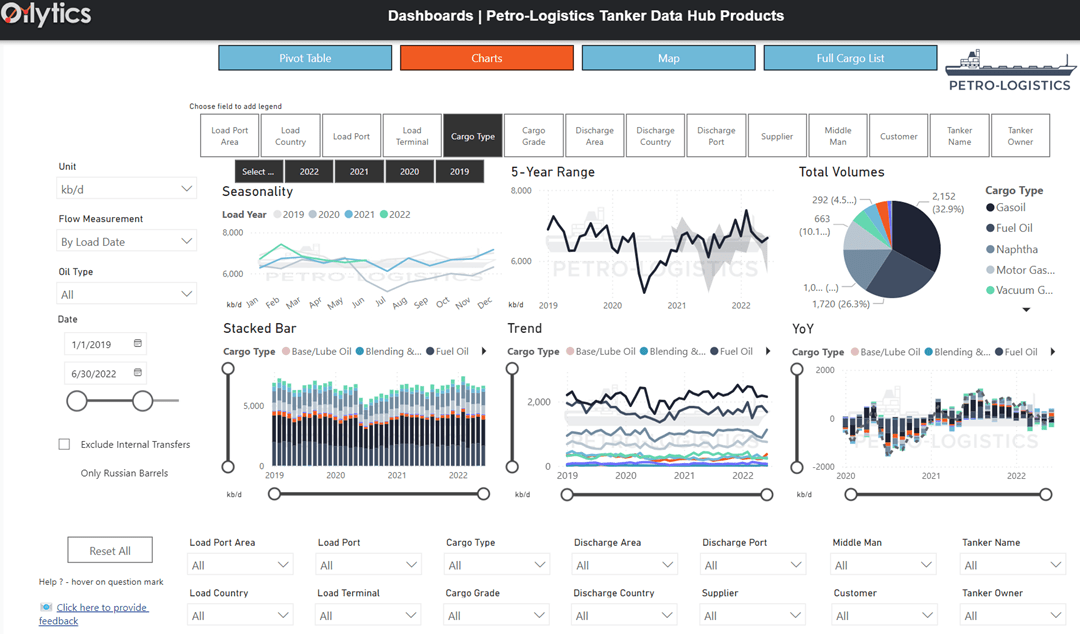
- Product Tanker Data Hub: Built with the same structure as the crude-focused version, this allows full exploration of the selected group of countries for which Petro-Logistics tracks refined product exports.
- Middle East Crude Oil Exports: Covers the Middle Eastern crude exporters tracked by Petro-Logistics including Iran, Iraq, Kuwait, the Neutral Zone, Oman, Qatar, Saudi Arabia, and the UAE. View, filter, and manipulate flows by grade, customer, liquid type, and discharge country and region.
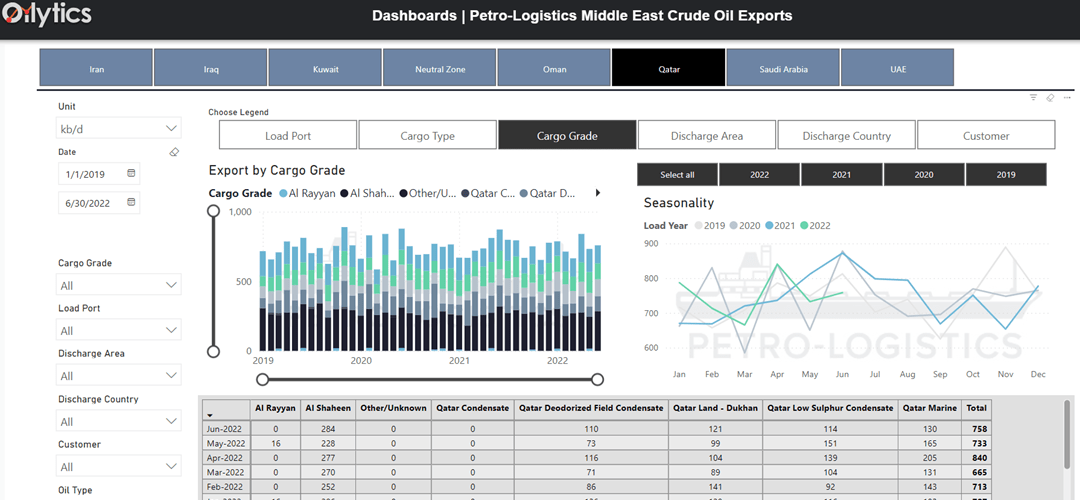
Further dashboards are under development, with more to be steadily rolled out going forward.
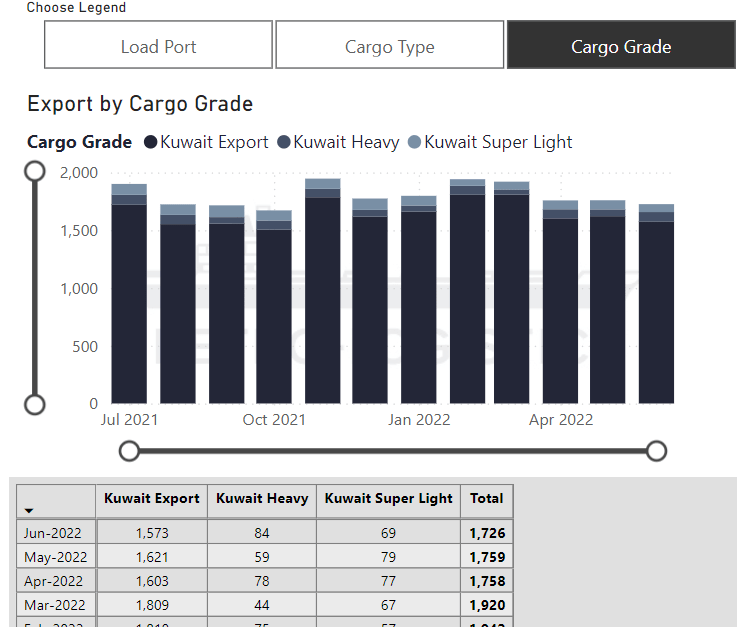
Many of the dashboards include our information on specific oil grades. This is one of the most unique pieces of information Petro-Logistics offers, with hard data from port and other sources built up over more than 40 years to a level which no one else in the tanker tracking industry can offer. Rather than blank cells or algorithmic guesses of unknown quality, we offer confirmed grade information at the tanker and aggregated level.
Until now, this grade information could be tricky and time-consuming to analyze, requiring a great deal of Excel or other software manipulation. Now we can offer dashboards providing a wide set of options to rapidly filter, group, cross-reference, and visualize the grade information in tables, charts, and tanker lists.
Click here or email us at sales@petro-logistics.com for information on trials and pricing for any of these new dashboards.

