New Americas Exports Dashboard from Petro-Logistics and Oilytics
Read in 2 minutes
If you are interested in a free trial of any of our dashboards please contact our sales team here or email us at c2FsZXNAcGV0cm8tbG9naXN0aWNzLmNvbQ==
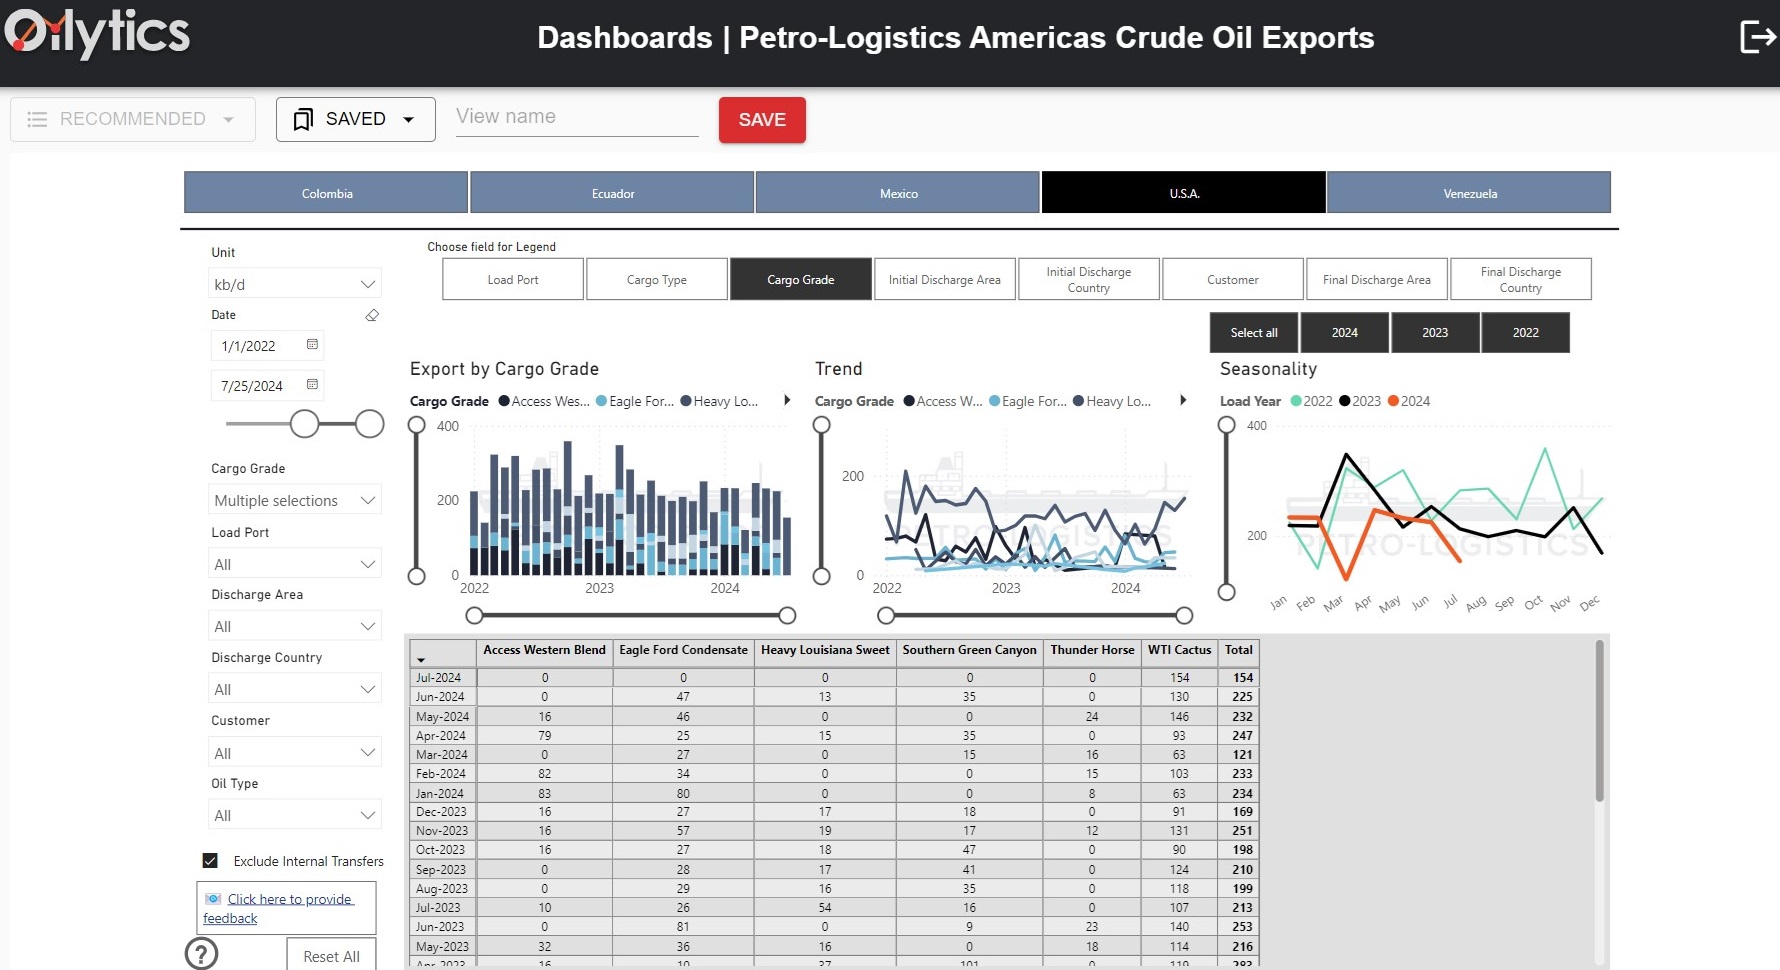
Petro-Logistics has partnered with data visualization platform Oilytics (oilytics.co) to offer a new set of web-based dashboards to easily and quickly draw out analytical insights from our industry-standard tanker tracking data. The latest tool is our Americas Crude and Condensate Exports dashboard.

The Americas dashboard is updated daily from our latest tanker tracking data and has data for all the countries Petro-Logistics covers in the region. These are the countries covered.
- Colombia
- Ecuador
- Mexico
- US Gulf Coast (including Canadian barrels which load from USGC ports)
- Venezuela
Any future countries Petro-Logistics adds coverage for in the Americas will be added to the dashboard as well.
The dashboard functions as follows.
- Select the exporting country to view.
- Set timeframe, units, and filters for load and discharge locations, grades, customers, and oil type.
- Choose a legend field for charts and pivot table column headers to produce the time series desired.
Other features of the dashboard interface include the following.
- Any configuration of selections and filters can be saved as a bookmark for easy standardized views.
- All data from charts and pivot tables can be downloaded in Excel format.
- Charts can be enlarged for easier detailed views when there are many legend series.
- The latest month-to-date flows are captured and refreshed daily.
This data can be found in our country Excel reports, but the dashboard gathers all our Americas coverage countries in one place and provides much greater flexibility, speed, and customized standardization in organizing and visualizing the data.
Click here or email us at c2FsZXNAcGV0cm8tbG9naXN0aWNzLmNvbQ== for information on trials and pricing for any of our dashboards.